1
/
of
1
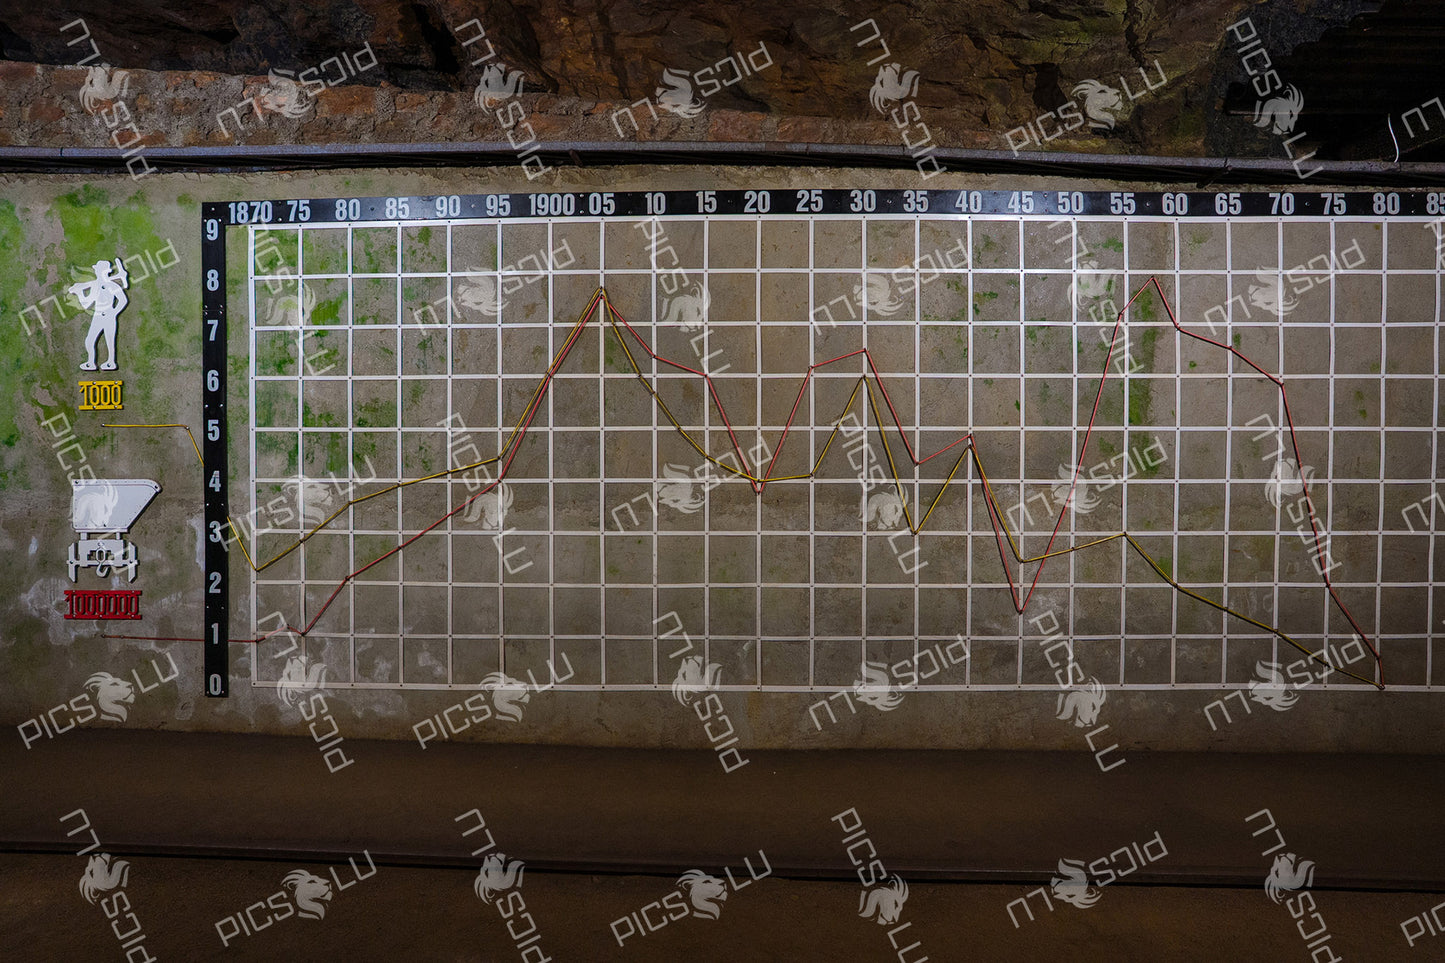
Mining production and labor statistics chart inside tunnel (1870–1980)
Mining production and labor statistics chart inside tunnel (1870–1980)
Regular price
€5,49 EUR
Regular price
Sale price
€5,49 EUR
Unit price
/
per
Taxes included.
Couldn't load pickup availability
A historical graph painted on a tunnel wall illustrates data trends related to mining from 1870 to 1980. The vertical axis shows values from 0 to 9, and the horizontal axis spans over a century, marked in 5-year intervals. Colored lines represent figures for workers, mining carts, and rail segments. This visual installation provides insights into the evolution of mining productivity and workforce over time, placed within a former mining environment for educational purposes.
Share